Introduction
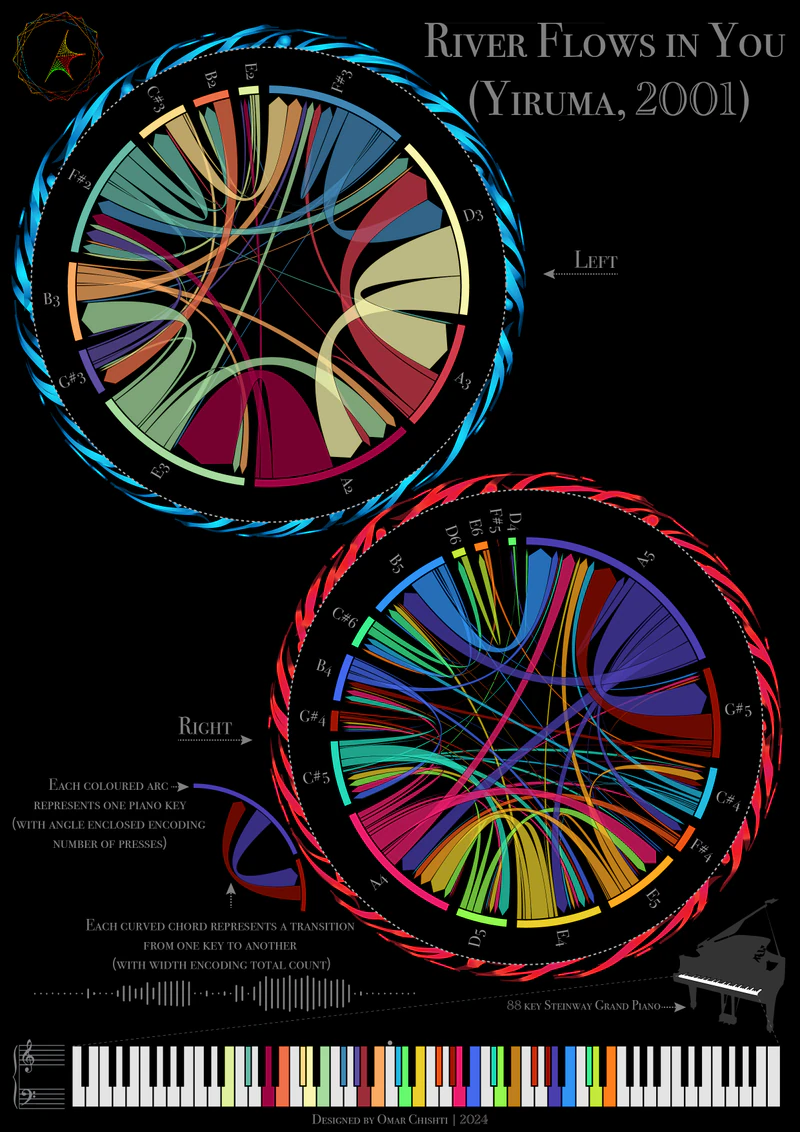
This piece depicts the networks traced by a pianist’s hands as Yiruma’s ‘River Flows in You’aYiruma (Lee Ru-ma) is a South Korean pianist and composer. ‘River Flows in You’ is from his 2001 album First Love. is played. In case you’re unfamiliar, I highly recommend giving it a listen while you analyse the piece above: YouTube/Spotify. The Rousseau channelbRousseau is a YouTube channel featuring visualised piano performances, where falling bars represent notes in a style reminiscent of the game Guitar Hero. I linked has stunning neon visuals to accompany the rendition — they formed part of the inspiration for creating the piece. It is an exceedingly simple melody, but it has never failed to bring me peace.
Circograms
Circograms or network chord diagrams are a neat way to visualise complex networks, and I first came across them while doing an undergraduate research project.1 The piece takes direct visual inspiration from my research on structural brain networks, where the strength of a cortical region’s connections to another is represented by edge width.
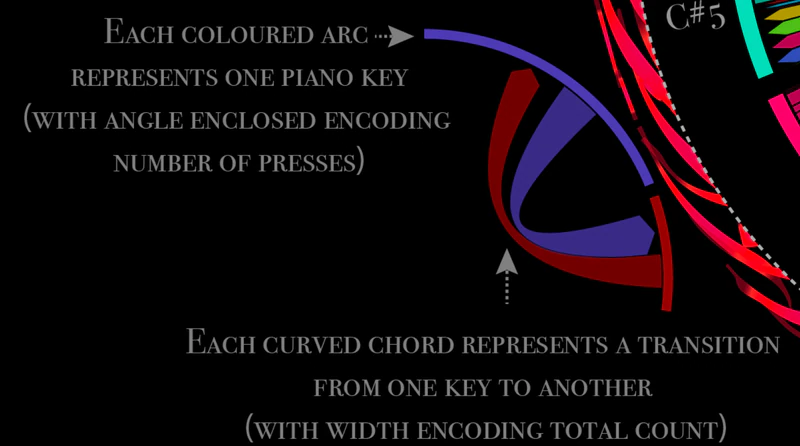
Each little segment on the outer border of the circogram represents a note, which is communicated via both colour and label. The note transition frequencies (here I mean the number of occurrences, not the sonic frequency) are encoded by the width of the directed arcs connecting different segments. The arcs between a given note pair (say A2 and E3) are asymmetric, since the number of transitions from A2 to E3 differs from the converse. This makes it a directed graphcEuler invented graph theory in 1736 to solve the Königsberg bridge problem — whether one could cross each of the city’s seven bridges exactly once..
The circogram for the right hand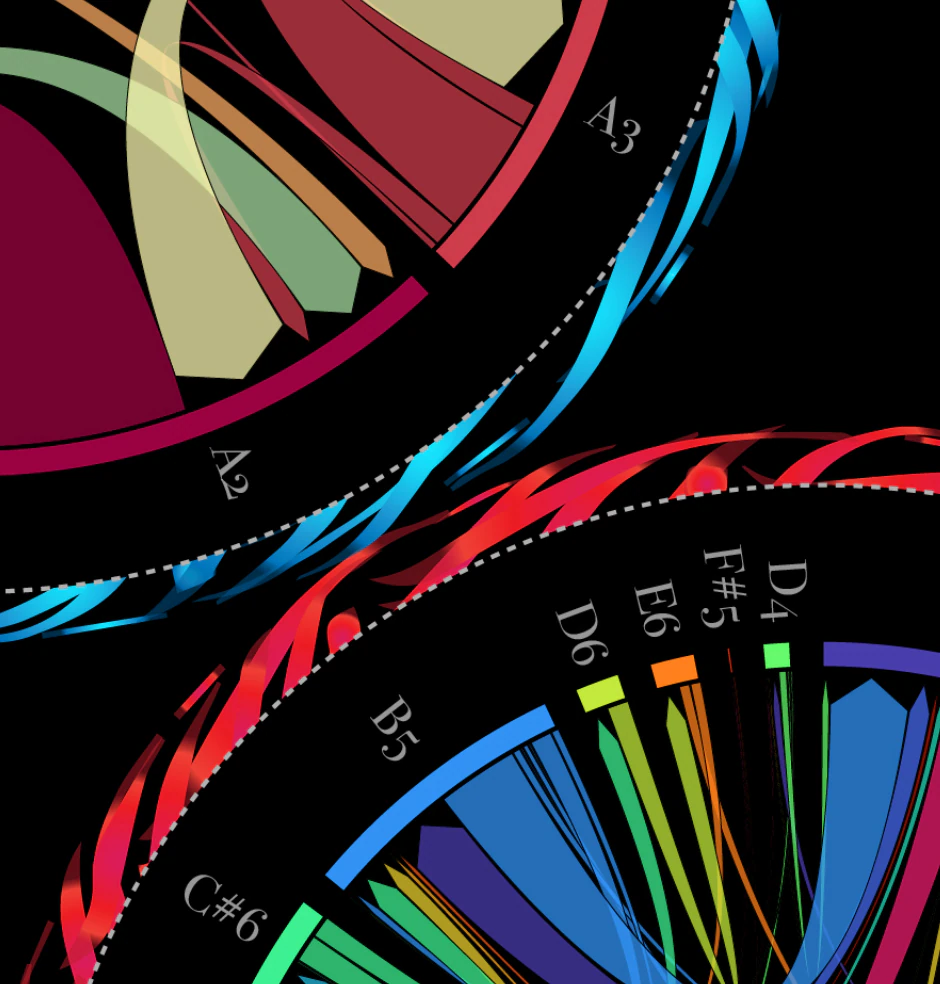 Figure i. Detail of the directed arcs connecting note segments. Arc width encodes transition frequency; colour follows the source note. is noticeably more intricate and more vibrant than the circogram for the left hand.
If you zoom out your perspective a bit, you might notice a superficial resemblance to a DJ turntable. I’ll leave the other visual easter eggs to your imagination.
Colour
People often ask me about the colours assigned to the notes. I did go on a whole quest to see if there was an ideal pairing. Newton divided the rainbow into VIBGYOR (seven colours)dThere is a statue of Newton at Trinity College, Cambridge. Wordsworth’s verses (‘The marble index of a mind for ever / Voyaging through strange seas of Thought, alone’) were penned based on it. because he believed there should be correspondence between the colour spectrum and the musical scale.2 The fact that visible light varies over one octave while audible sound varies over ten complicates any association schema. In the end I went with built-in colour maps and made some intuitive edits, which works well enough.
The dimension of time is collapsed and the precise order of notes/their duration/their loudness cannot be recovered from this particular depiction. I was tempted to add some extra features that would preserve more of the original tune’s information, but this seemed like a suitable end point for the static visualisation. I coded up an animated version that highlights the notes in real time while playing the song using simple sound synthesis.
The 88 piano keys in the legend Figure ii. Detail of the keyboard legend, E2 to E6 in the song’s colours. The dot marks middle C, which the song never plays: notes below it form the Left circogram, notes above it the Right. are colour-coded to match the note segments in the circograms — any keys/notes not in the song are left black/white, as they would appear on an actual piano. Each piano note has an associated MIDI number which helped make my programmatic analysis of the song considerably simpler.
Code
The code I wrote for this visualisation takes the MIDI file of the song as input, parses it, and converts it to a format suitable for network representation.
This essentially involves moving from a sequential representation of the notes in the song to one that only captures the relationships between adjacent note pairs.
I separated the song into two networks to bring out the mechanistic relationship to a pianist’s hands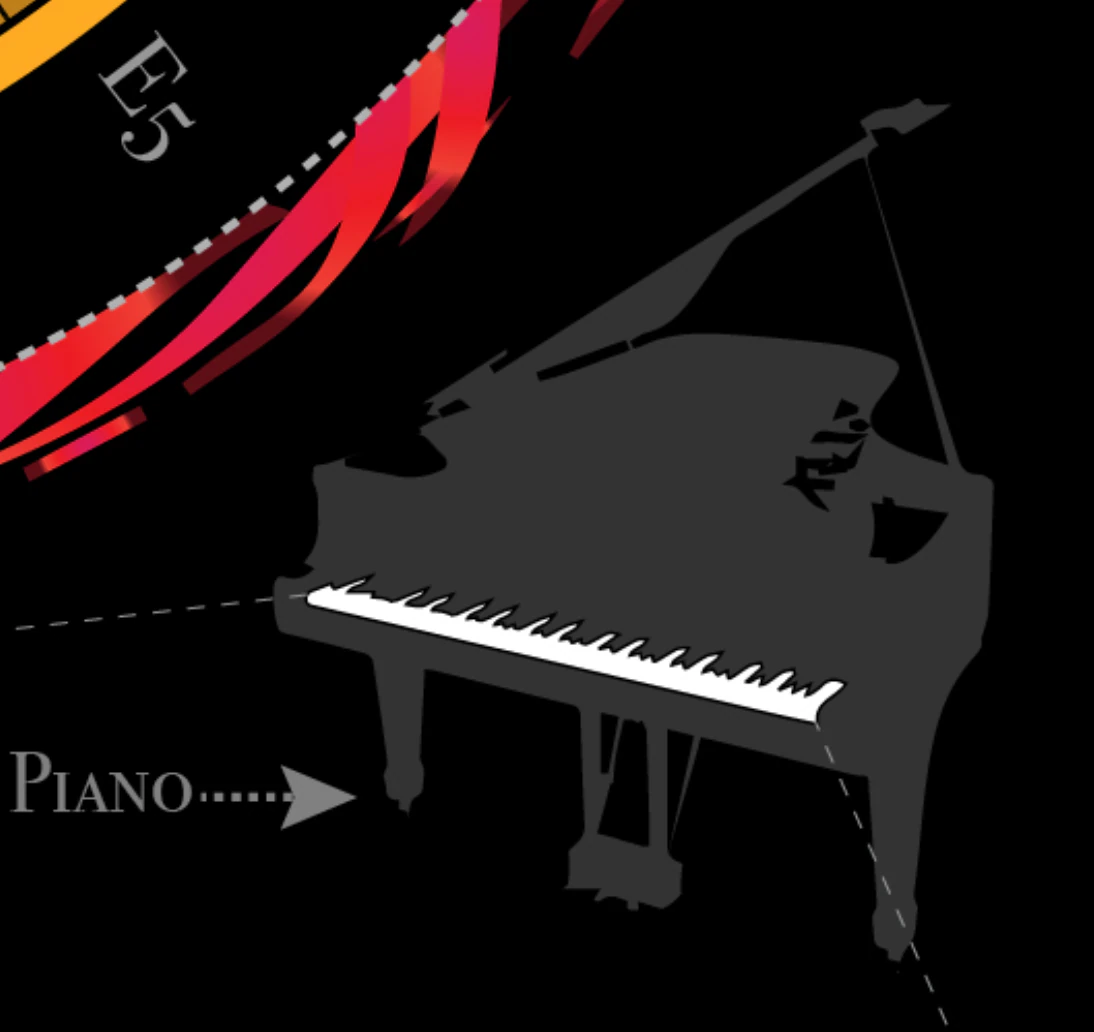 Figure iii. The piano silhouette — a dashed leader line traces the instrument to a magnified representation of the keys. — which intrinsically translates to the two contralateral brain hemisphereseThe brain’s motor control is contralateral: the left hemisphere controls the right side of the body, and vice versa. whose networks inspired the whole thing! MIDI note number 60 (C4 or middle C) was set as the inflection point between hands. This is a simplification of how a pianist operates.
Once I had the network data in two tables with the right format (Note 1 | Note 2 | Count), I generated the circograms using RAWGraphsfRAWGraphs is an open-source data visualisation framework developed at Politecnico di Milano’s DensityDesign Lab. (the same tool I later used for visualising phylogenetic trees). The Python libraries for circogram generation did not have the kinds of results I was looking for. I think notes are placed on the circogram in order of appearance, clockwise from 12:00. Finally, I went on to throw everything together into one cohesive whole using Adobe Illustrator. I have since mostly finished stitching the code together to be able to go straight from MIDI file to final visual, but automating the process entirely to pump out versions for all the classical pieces I like would take some of the soul out of it.
Conclusion
This piece is dear to me because it was the first from my data-driven art series.
One of the central things I wanted to capture with this visual is the possibility of translation between sequential and network representations of information. The power of perspective.